Fluoride Fibers
Supercontinuum generation fibers
Thanks two their non linear properties, combined to their high transparency from UV up to mid-IR, fluoride fibers are widely used for supercontinuum generation.
In 2006, the first supercontinuum generation, extending from 0.8 up to 4.5µm was demonstrated from LVF ZBLAN fluoride fibers by Xia et al. [ref].
ZFG and IFG fluoride fibers are integrated in the commercial supercontinuum source Electro-MIR 4100 and Electro-MIR 4800, developed in colaboration with LEUKOS.
Our two star fibers for supercontinuum generation are:
1) ZFG SM [2.55] 8.5/125
Core/clad diameter
Cutoff wavelength
Numerical aperture
Zero Dispersion Wavelength
Non linear refractive index n2 (x 10-20 m²/W)
Operating wavelength
Typical background loss
8.5/125 µm
2.55 µm
0.23
1.535 µm (experimental)
≈ 2.1
0.3 – 4.5 µm
< 10 dB/km
Consult our fluoride fibers/general properties section to learn more about this fiber.
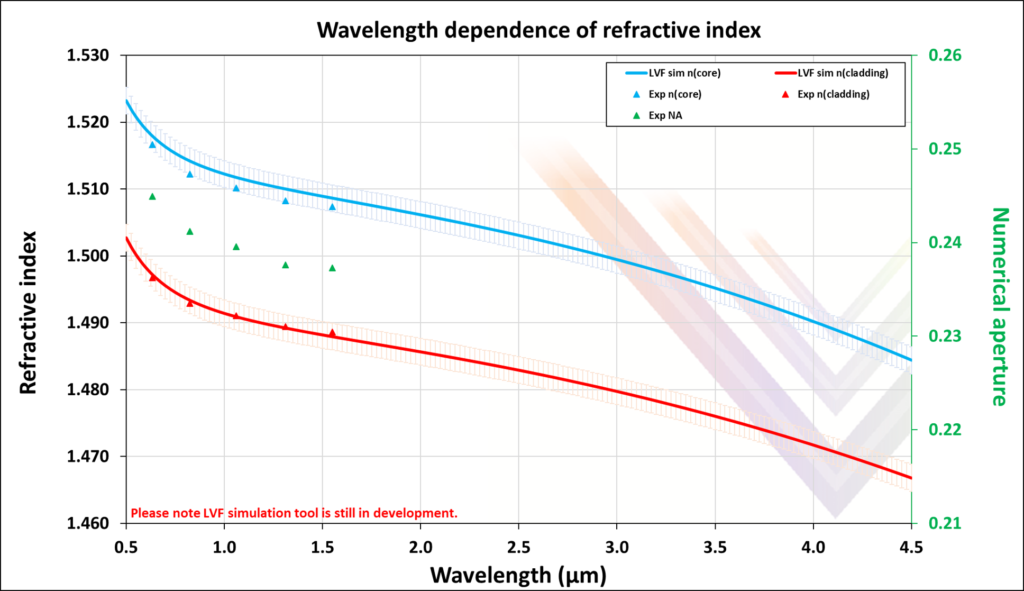
Find below the wavelength dependence of core and cladding refractive indices of our 8.5/125 non linear fiber:
Here are some supercontinuum results obtained with our ZFG single mode fibers thanks to their non linearity:
Spectral broadening | Average power | Ref |
|---|---|---|
0.8 – 4.5 µm | 0.023 W | Xia, 2006 |
0.8 – 4.0 µm | 1.3 W | Xia, 2007 |
2.6 – 4.1 µm | 0.154 W | Gauthier 2015 |
2 – 4.70 µm | – | Michalska 2017 |
2 – 4.4 µm | 2.45 W | Grzes 2018 |
2.7 – 4.25 µm | 1.75 W | Yang, 2018 |
1.9 – 4.0 µm | 5.4 W | Xia, 2020 |
1.92 – 4.29 µm | 20.6 W | Yang, 2020 |
2) IFG SM [2.95] 7.5/125
Core/clad diameter
Cutoff wavelength
Numerical aperture
Zero Dispersion Wavelength
Non linear refractive index n2 (x 10-20 m²/W)
Operating wavelength
Typical background loss
7.5/125 µm
2.95 µm
0.30
1.65 µm (experimental)
≈ 3.2-4.3 [ref]
0.3 – 5.5 µm
< 30 dB/km
Consult our fluoride fibers/general properties section to learn more about this fiber.
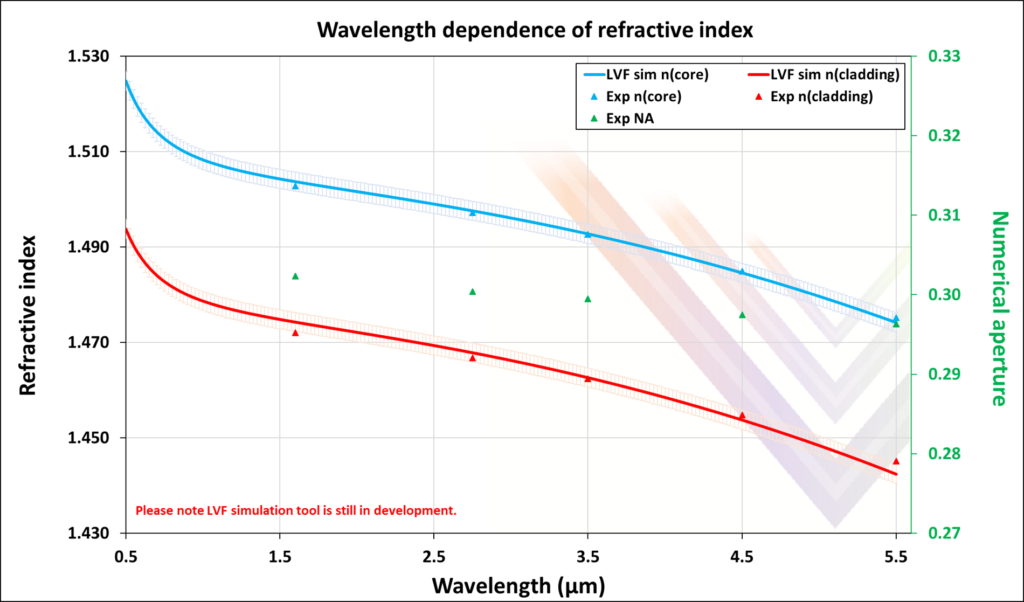
Find below the wavelength dependence of core and cladding refractive indices of our 7.5/125 non linear fiber:
Here are some supercontinuum results obtained with our IFG single mode fibers thanks to their non linearity:
Spectral broadening | Average power | Ref |
|---|---|---|
2.7 – 4.7 µm | – | Théberge, 2013 |
1.0 – 3.05 µm | 2.09 W | Swiderski, 2014 |
2.4 – 5.4 µm | 0.008 W | Gauthier, 2016 |
1 – 5 µm | 1.0 W | Théberge, 2018 |
2.6 – 5.4 µm | 0.145 W | Gauthier 2018 |
1.85 – 4.1 µm | 1.41 W | Michalska 2018 |
1.5 – 5.2 µm | 1.35 W | Yang 2018 |
1.9 – 5.1 µm | 4.06 W | |
1.8 – 4.6 µm | 3.0 W | Yehouessi, 2019 |
– | 6.7 W | |
2 – 4.7 µm | 7.0 W | Scurria, 2020 |
1.9 – 4.9 µm | 11.8 W | Yang, 2020 |
![]()
We acknowledge LEUKOS for ZDW measurements.
![]()
We acknowledge Glass and Ceramics team from Rennes 1 University for their contribution to refractive index measurements


